
Organising your thoughts and data in a research report can be tricky. Once you have all your figures sorted out and all your references in a database you need to actually start putting together the document. Here are four MORE tips and tricks to help with organising your information and getting good references.
This blog will add four more ideas to make writing your final year research project or dissertation a less painful experience. If you have not seen the first blog then Part 1 can be found here (making and moving figures around more easily). The next bit is the hard bit: once all your figures are in place then you need to start writing and organising. There are lots of simple tools in Word and tricks that can be used to help set out your information.
1. Use tables in Word to arrange data
Back at the dawn of the internet age, for those of use lucky enough go to university in the 90’s, you had to to learn to program in html to make a web page. Tables were used a lot to set these out. You can use the same strategy to format your information within your documents and to help arrange figures and information.
Tables allows you to insert a grid within your document that you can use to place and organise text. The benefit over Word boxes is that they don’t float around when you move text, keeping your formatting in one place. The borders on the table can be made invisible once you have it the way you like. Use two rows and one column for a single figure; larger grids can be used to organise other information.
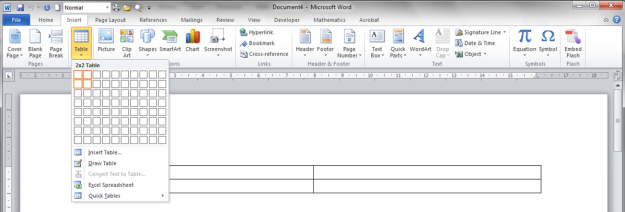
1. To put a table in a Word document, click on the Insert Tab, click on Table and then select the number of rows and columns boxes you want.
Each box in the table is called a cell. If you want to merge two together, left click and drag over the cells you are interested in. You then need to right click on the selection or click on “Table Tools” and then Layout. Merge Cells will appear. Click on that and the two cells will become one.
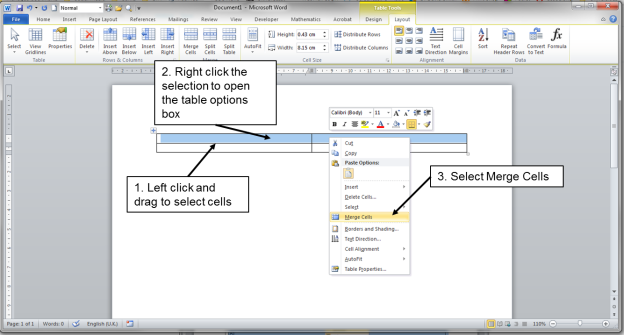
2. You can merge two cells together to make a handy area to place your figure legends.
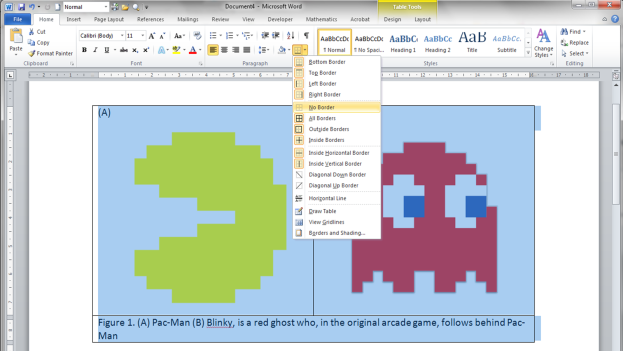
3. Once you have made your table you can paste images in and add text to any of the boxes. To get rid of the border, left click and drag over the table. Then on the little table icon click on the No Border button.
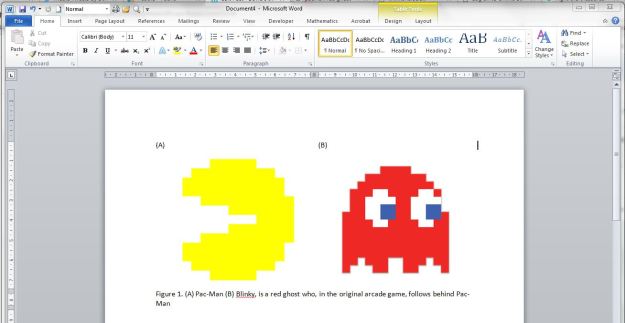
4. Finished figure is now fully set and justified.
The finished table is now a figure in your report/dissertation. Tables are also a great way of setting out your CV without all the text jumping around every time you add a new word.
2. Who cited that key paper?
So, you’ve got that killer reference in the introduction, a seminal paper setting out key findings that have never been seen before! Then you get the comment – “this paper was written 20 years ago, can you find a more recent reference?”
Let’s use the first gene editing paper published in Science as an example to see how well it’s done since being published. In January 2013, the Zhang lab published the first method to engineer CRISPR to edit the genome in mouse and human cells. How has that paper done and where was it cited recently?
Handily both Google Scholar and Web of Science have “cited by” functions. Clicking this link gives you all the papers that have cited your original source. Well over 6,200 citations in five years 😳
You can use these citations to demonstrate the impact of a paper or how the work within it has been built on.
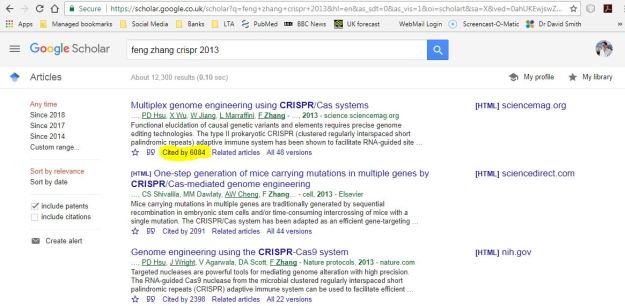
Click on the Cited by link on Google Scholar to give you all the papers that have referred to that paper. You can even click on the Since 201X links on the top left corner to narrow down the search to different years.
3. Getting to the point of the project?
What do you want the reader to know and how are you going to lead them to the conclusion? Before you even start writing, sit down and think through what you did. Get all your information together and look at it as a whole. You don’t have to write it up in the order in which you did it; your data, information and findings can be arranged so that they tell the most logical story. Lead the reader from one point to the next and build on what went before.
Use the introduction to focus into your specific question.
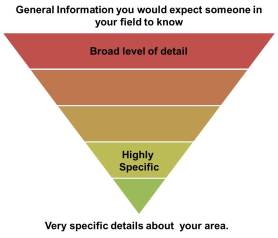
Setting the scene. Use the introduction to set out the key information. You are going to refer to this as you go along. It’s okay to go back and add information into the introduction later in the writing process. The introduction is the section setting up the environment in which the results or findings were gained. You cannot explain everything, so don’t try. Start broad and focus in paragraph by paragraph until you get to the question you are addressing. You can think of it as an inverted triangle where the tip is the focused area you are working on and the wide base is the knowledge you would expect someone else in your field (on your course) to know.
The main action. The results should be to the point. Tell the reader what you want them to know. Don’t leave it to their imagination, but set out the findings clearly at the start of each section. You should be able to state the key points in a sentence or two. The figures are your evidence to back up that point and the text is your explanation. Structure the paragraphs in your results sections such that you have:
- Opening statement (short, to the point, setting out what this section is about)
- All the information and detail (develop your ideas, set out your evidence)
- Closing statement (a sentence stating the key finding from that section)
In this way each paragraph of your results has a point. You can use the opening statement to link back to the last closing statement, building on what you have found as you write.
4. Summary figures (and overall structure)
The discussion section is where you set out your key findings, placing those findings within current knowledge. How does your work compare? Did you come to a similar conclusion or not? Getting those findings across in words can be tricky, so this is where a summary figure can work really well, giving the reader a visual overview. Reviews, theses and dissertations all use summary figures to visually demonstrate the key points. For you, it’s a way to demonstrate that you have thought through your findings and have organised your ideas enough to draw a final conclusion.
To make these summary figures I tend to use PowerPoint (more powerful packages such as CorelDRAW are really good, but take longer to master). The format object function allows you to set the size of the items. Use the arrange function in PowerPoint to get everything neatly lined up. Once all your items are together, use the group function to make them one item and paste the image into your report as a jpeg as covered in the last blog.
The best way to demonstrate this is to do it, so here is a summary figure of my eight hints and tips. The red represents the general knowledge in your field, the green is the specific detail you worked on. See how you can start broad in your writing, focus in, set out the specifics then place those findings in the context of the wider world.
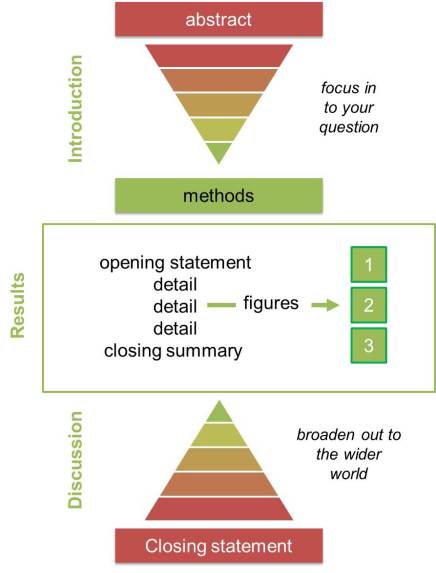
Overview of a research report/dissertation
If you have other hints and tips that can be used when writing reports/dissertations, please leave them in the comments section. The final blog post in this series will look at four hints and tips to get you through your viva (watch this space).
